1) In this video, we are going to explore
NOTE:
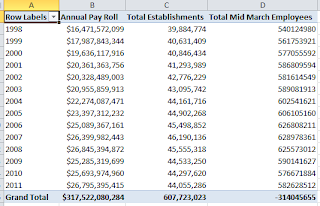
We observed that "GrandTotal" for the "Mid March Employees" is being displayed as a negative number.
The reason is data type is "Integer" for "Mid March Employees" and the "Grand Total" column value is exceeding the limit of an "Integer". So let's change the data type to "BigInt" to fix the issue.
Before correction:
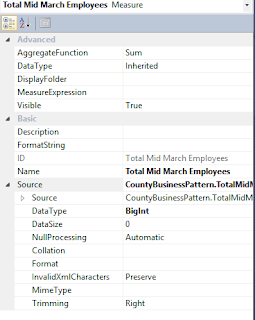
After correction:

- Data sources
- Data source views
- Measures and Dimensions, formatting of measures
- Processing a Cube
- Browse a Cube
- Browse a Cube in Excel, Create line charts and column charts
2) Few screen shots while building the cube:
Datasource view:


4) Key highlights are in the video:
Datasource view:

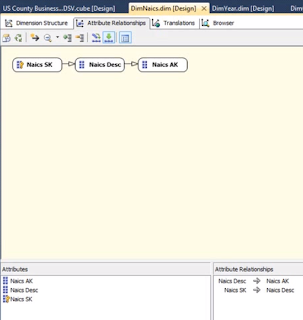
User-Defined hierarchies:

Browse cube:

Cube in Excel:

Cube in Excel + Column Charts:

4) Key highlights are in the video:
We observed that "GrandTotal" for the "Mid March Employees" is being displayed as a negative number.
The reason is data type is "Integer" for "Mid March Employees" and the "Grand Total" column value is exceeding the limit of an "Integer". So let's change the data type to "BigInt" to fix the issue.
Before correction:

Correction: Changing the data type to "BigInt" for "Mid March Employees"


No comments:
Post a Comment